For some reason which is unable to be disclosed at this moment, we recently held a long internal tech talk deep diving into our current service stack here at Insight.io. It covered pretty much everything of our system, ranging from backend to frontend architecture, from devops to development tools. Everybody was involved in the talk sharing and reviewing the work they have contributed to. It was a huge success that everybody got very excited and felt very fruitful after that.
One idea keeps haunting me in my mind after the talk is why not document this talk into a series of posts for future references. Or maybe, to some degree, help others who are curious about Insight.io.
A bit introduction about what we do here at Insight.io: we do web-based code search helping users (developers) to search and understand source code better on top of our featured code intelligence analysis engine. Product-wise, we provide SaaS and on-premise versions of our software.
There are a couple of aspects of the system that I want to record in this series of posts, but I don’t wanna spending too much time on thinking about how to organize them. Instead, I prefer picking up one random topic I feel to talk the most each time. So as of today, I’d like to talk about Message Queue in our stack.
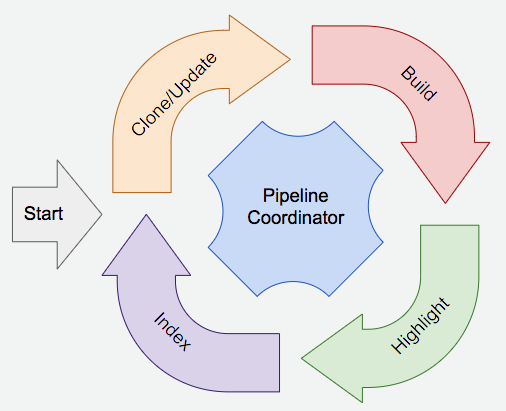
I think a very brief introduction of the overall backend architecture of Insight.io would be helpful. Our code intelligence analysis engines analyze source code, a git repository to be more specific. Each git repository has to go through the following analysis stages: Clone -> Build -> Syntax Highlighting -> Search Indexing.

Our stack is micro-service architectured with Apache Thrift and Twitter Finagle. This analysis pipeline is accomplished by multiple distributed components. One service for each stage.
For our SaaS version, all of the micro service instances are deployed on our own Kubenetes cluster on AWS, while the on-premise version was packed by Docker Compose.
Like most of the use cases of message queue, the problem we are trying to solve is to decouple the mutual dependencies among micro services.
The analysis pipeline coordinating communication was done by RPC in the first place because of simplicity. However, a successful RPC call requires the remote service (or even the dependent remote services of this remote service) to be alive in a given time period even with RPC failure retries. This assumption does not hold in a distributed environment, where services could be up and down for unknown reasons, particularly during the Kubenetes’ rolling updates period. As a result, some stages of the analysis pipeline might not be executed eventually for a given git repository. It’s such assumption of RPC calls make the micro services tightly coupled together. Message queue aims to crack this tight-coupling issue by, in short, persisting request messages.
Meanwhile, it also provides other benefits like better monitoring, debugging and traffic throttling, etc.
We were mostly choosing between Apache Kafka and RabbitMQ back then, both of which are the most commonly adopted message queue solutions. The major reason RabbitMQ stands out is its independents, while Kafka relies on an additional ZooKeeper server. Our use case does not have an extremely high throughput and we don’t have any particular rare use case other than message publish/subscribe, so they don’t make any difference in terms of this concern.
Personally, I also thought about a light-weighted solution of using Redis PUB/SUB or Redisson for the sake of system simplicity without even bringing an additional message queue component, because we have already adopted Redis for caching and Redisson for distributed locking our stack. However, since they are not dedicated message queue solutions, they don’t provide a fullset of message queue features as RabbitMQ does.
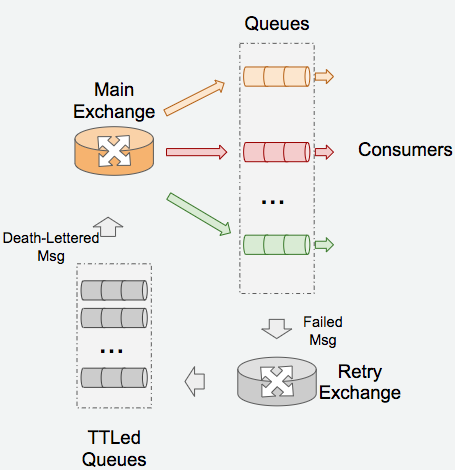
The overall architecture is quite self-explanatory from the image above. The Main Exchange acts
as the router for all request messages based on their routing key (Topic exchange). Micro services
as message consumers create queues binding to a particular topic pattern to subscribe a certain group
of messages, e.g. data.service.# for all messages with routing key started with data.service., which
serves as the topic pattern for a service called DataService in our stack.
To achieve message throttling to avoid traffic spikes, simply apply this.getChannel().basicQos(...) to
queues.
Other than the Main Exchange, there is also another Retry Exchange there particularly for message handling failure retries. Message handling failures are not rare in such a distributed environment as ours for various reasons, we need to backoff and retry the message delivery for multiple times in most cases.
The Retry Exchange is decicated to do this job. All the retry messages are sent to this exchange.
Different from the normal request messages, these retry messages are tagged with a retry count and their
routing keys could reflect the retry count by adding a suffix like xxx.xxx.retry.32000 indicating that
the message needs to be hold for 32,000 ms before the next retry.
There are a couple retry queues (in our case the number is 5) subscribed to this exchange based the
backoff time suffix pattern, e.g. #.retry.32000. Each queue has a different message TTL so that all the
messages in the queue won’t live longer than a certain TTL. When a message expires, instead of being
completely discarded, it’s transferred to the Main Exchange by specifying the death letter exchange
properties (x-dead-letter-exchange) of the message queue.
An example of the entire lifecycle of a retired message: 1) A message with routing key data.service.xxx
was handled unsuccessfully; 2) Redirect the message to the Retry Exchange and increment the retry count
tag by 1 and update they routing key to be data.service.xxx.retry.8000; 3) Hold the message by the
message queue with TTL 8,000 ms; 4) Transfer the message to Main Exchange so that it’s being delivered
to the original services again, since the prefix of the message’s routing key does not change (still
follows the pattern data.service.#). If failed again, repeat the process but increment the delayed time
so on and so forth.
This entire retry strategy is wrapped into a light weight message queue handling library so that it can be reused by all services.
Since we use Apache Thrift to define data structures pretty much everywhere in our code, we follow this convention to define message data structures as well, so the all the messages can be recognized seamlessly in the services without extra serialization/deserialization efforts.
In production, all the messages are serialized by Thrift in binary, while in development environment, we have urges to serialize the messages in a more readable way (JSON). We did tiny plumbing work to make the message queue handling library to support deserializing messages from JSON. So that we can construct and throw arbitrary messages into the stack for the sake of debugging in RabbitMQ’s web console.
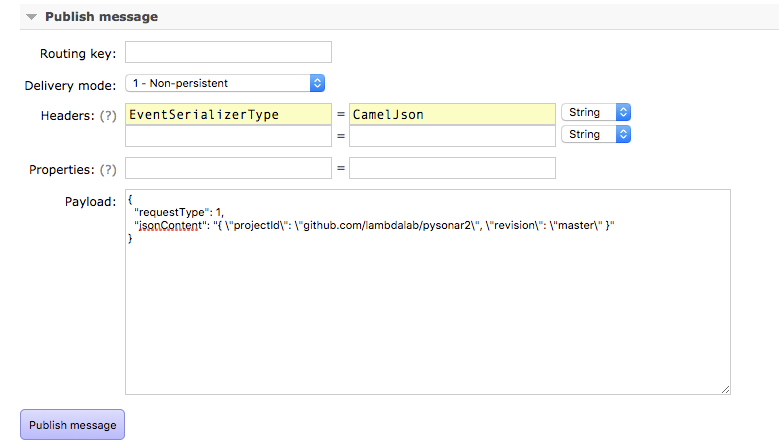
As a very mature message queue product, RabbitMQ’s own web console already has very powerful monitoring dashboard.
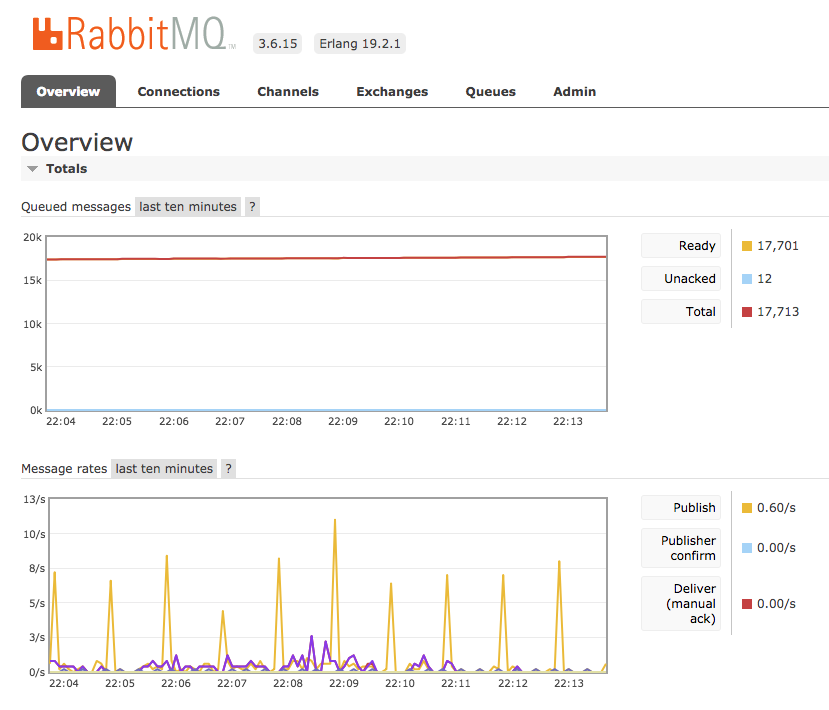
As our main metrics monitoring tool, Datadog also provides buildin dashboard with minimum setup effort.
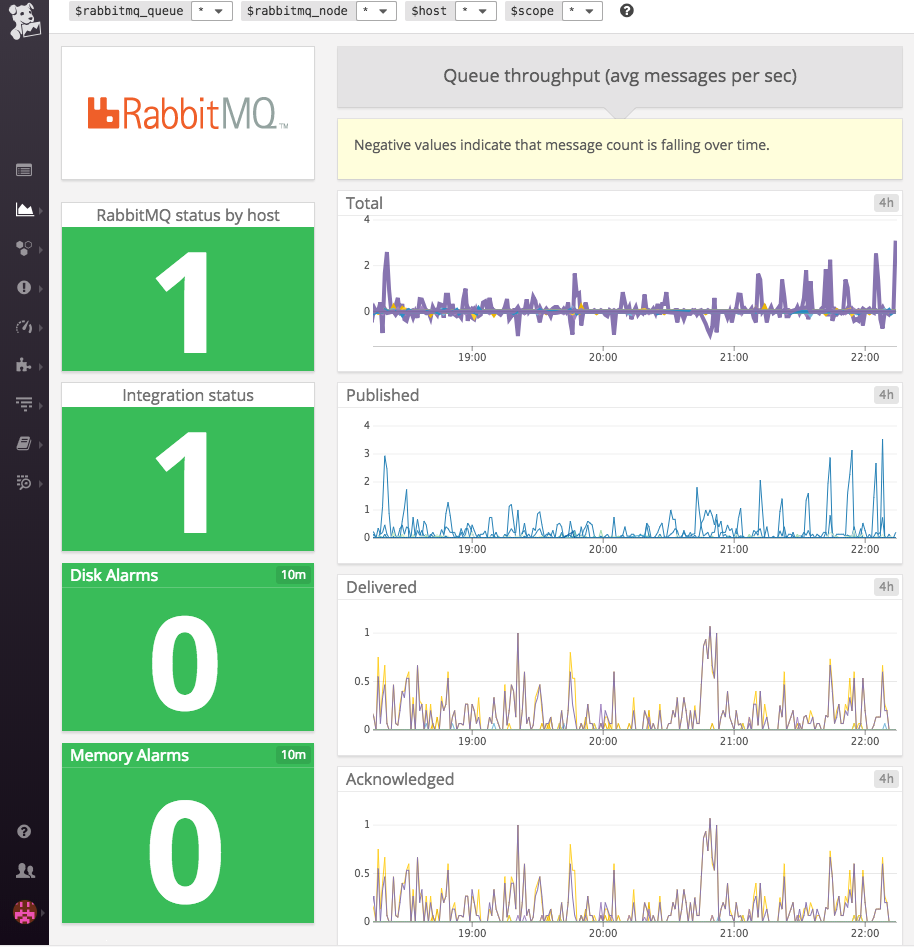
One sacrifice we made by using message queue instead of finagle RPC is that we breaks the buildin support for
Zipkin, which is a very popular distributed tracing system inspired by
Google Dapper paper, because the TraceId will be missing at the
end of message receiver.
To fix this issue, we have to do a bit manual effort to save the trace and span context of the tracing in the sender of the message as message header items.
  Trace.idOption match {
    case Some(spanId) => Map(
      Header.TraceId -> spanId.traceId.toString(),
      Header.SpanId -> spanId.spanId.toString(),
      Header.ParentSpanId -> spanId.parentId.toString(),
      Header.Sampled -> spanId.sampled.getOrElse(false).toString
    )
    case None => Map.empty[String, AnyRef]
  }
At the message receiver’s end, parse these trace and span context out from the message header and then backfill the context for the tracing in a different process other than the sender.
def getEventTraceId(properties: AMQP.BasicProperties): TraceId = {
  val headers = properties.getHeaders.asScala
  val spanIdOpt: Option[SpanId] =
    headers.get(Header.SpanId).flatMap{ spanId => SpanId.fromString(spanId.toString) }
  spanIdOpt.map { spanId =>
    val oldTraceId: Option[SpanId] =
      headers.get(Header.TraceId).flatMap{ spanId => SpanId.fromString(spanId.toString) }
    val oldParentId: Option[SpanId] =
      headers.get(Header.ParentSpanId).flatMap{ spanId => SpanId.fromString(spanId.toString) }
    val oldSampled = headers.get(Header.Sampled).map{ sampled => sampled.toString.toBoolean }
    TraceId(oldTraceId, oldParentId, spanId, oldSampled)
  }.getOrElse {
    Trace.nextId
  }
}
  Trace.letTracerAndId(DefaultTracer, getEventTraceId(properties)) {
    handleRequestFuturePool {
      Trace.time(s"$EVENT_TRACING_PREFIX ${event.requestType} Received") {
        handleRequest(request, channel, envelope, properties, event)
      }
    }
  }
As your message queue implementation evolves, the properties or settings of the queues are changing along the way. However, some updates of properties might be conflicting with existing settings. This is going to be an issue while releasing new versions of stacks.
One way to solve this issue is to hash the properties map into string and make the hash value a part of the message queue names. Whenever there is a change of properties, the stack will create new message queues instead of reusing existing ones. And to make things cleaner, we also garbage collect the old message queues automatically.