Insight.io Tech Stack (3) - Infrastructure and DevOps
The last post Insight.io Tech Stack (2) - Serving and Analysis Pipeline covers mostly how our serving and analysis logics are distributed in our stack. However, to make sure the entire stack works together reliably as a successful product, there are much more issues to be addressed:
- How to log, monitor and profile all these components.
- On which infrastructre platform to host the stack and how to orchestrate on top of it.
- How to package and release services.
- What kind of developer tools to use to maximize developement efficiency.
These are all the aspects this post is going to talk about. In the meanwhile, you can refer to the earliest post Insight.io Tech Stack (1) - RabbitMQ Practices in Insight.io to find out the original motivation behind these posts.
Logging & Monitoring
Logging
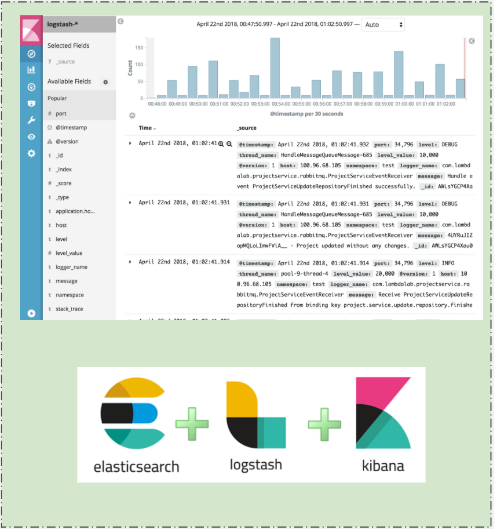
Since most of our stacks use Scala, logging is fairly straight-forward with slf4j binding. To make all the logs easy to access and searchable, we adopted the Elastic-Logstash-Kibana (ELK) Stack to accommodate all the logs. slf4j is configured to redirect all the logs to Logstash, which is responsible to index all the logs into ElasticSearch. Then Kibana is the frontend portal to search all the logs.
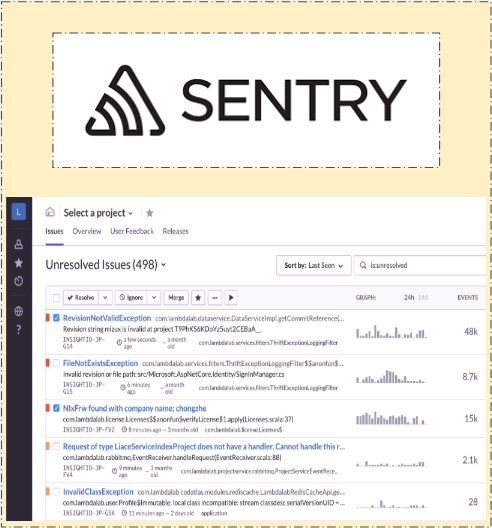
In most of the time when you resort to logs, you are looking for exceptions. To better manage and track serving exceptions, we use Sentry to structurally log exceptions. It helps to provide additional stats regarding different type of exceptions and can automatically create and track exceptions with GitHub issues.
Monitoring
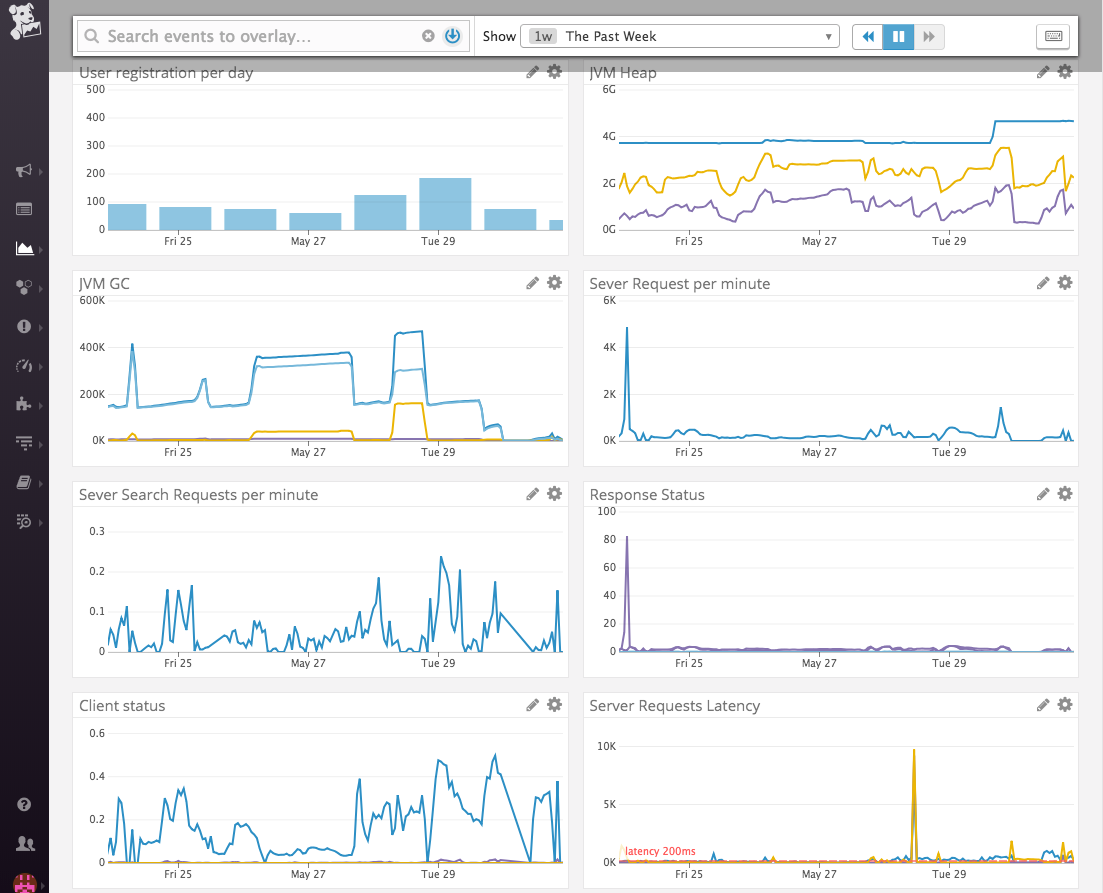
To monitor the status of all components in the stack, we use Datadog to collect all their real-time performance for our SaaS version. (For on-premise version stack, we use Prometheus, an open-source alternative to Google Borgmon, to track time-series service performance data.). For our micro services, Finagle and JVM stats are collected with minimum effort. ElasticSearch, MongoDB, Redis and RabbitMQ instances have built-in support in Datadog. Also, we can add customized metrics inside each service.
Distributed Tracing
To trace how a request is going through all the distributed services, we use [Zipkin] (https://zipkin.io), an open-source alternative to [Google Dapper] (https://ai.google/research/pubs/pub36356). It can be integrated with Finagle with trivial work. However, to make sure it integrates with RabbitMQ, we did some plumbing work as described in Insight.io Tech Stack (1) - RabbitMQ Practices in Insight.io.

Cluster Infrastructure
Infrastructure
We use Amazon Web Services (AWS) extensively, including but not limit to EC2, S3, Route53, ECR, ELB, CloudFront etc. For EC2 instances, we use a mixture of reserved and spot instances to reduce the cost. Our production cluster is placed in Japan to serve both U.S. and China, the 2 places where most of our users come from, to avoid the extra efforts to maintain 2 clusters. In addition to the production cluster, we also maintain 2 staging cluster for our internal usage in North America.
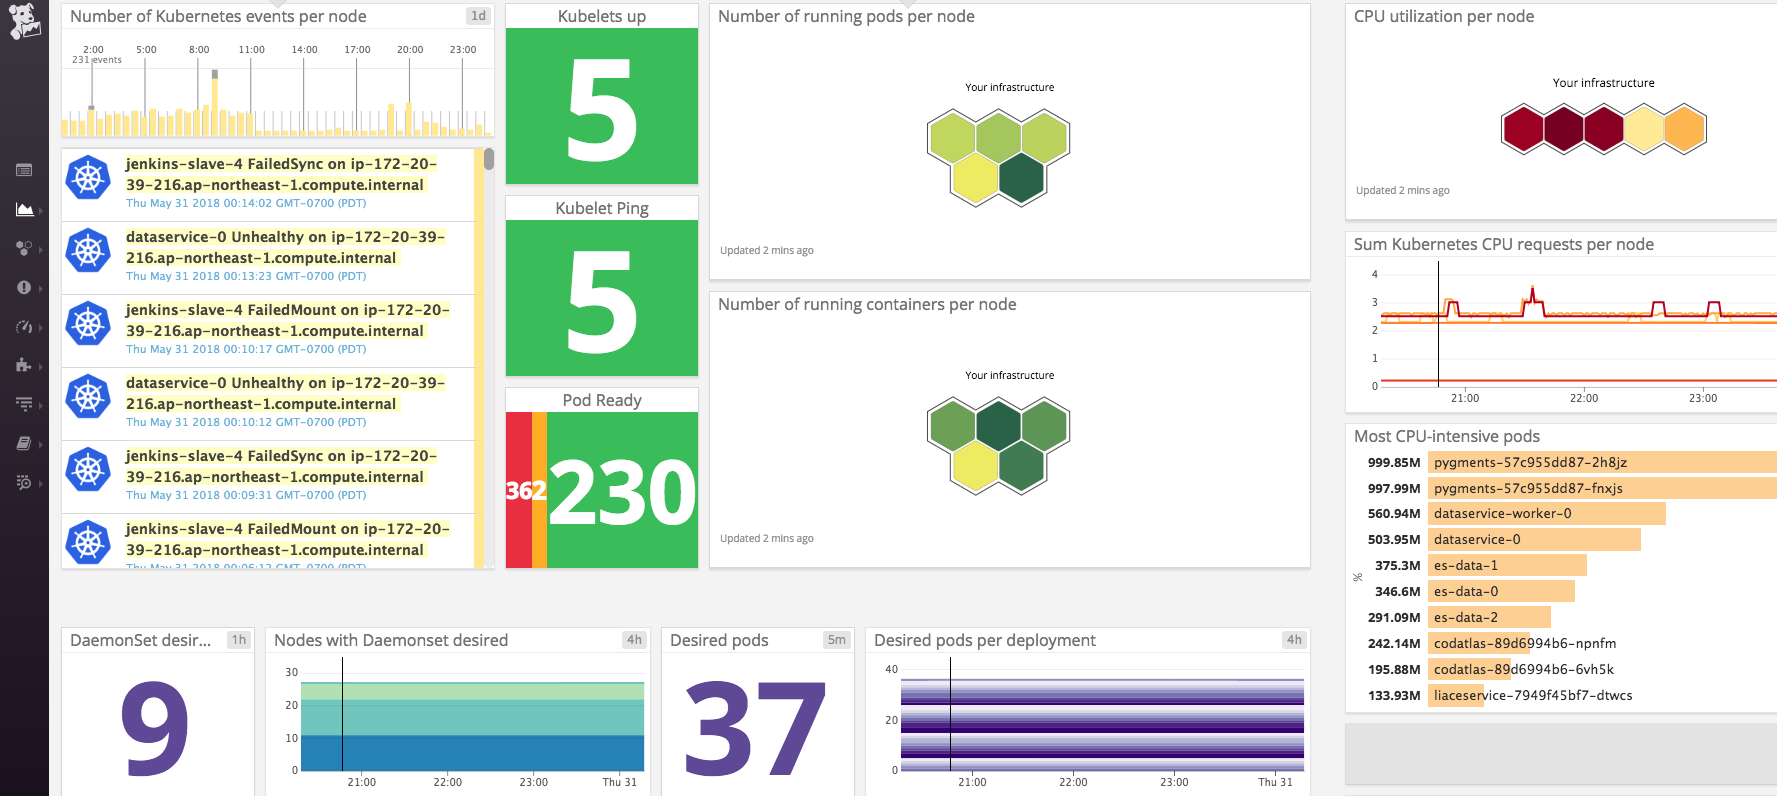
To echo Infrastructure as Code philosophy and better provision these AWS clusters and services, we adopt Kubernetes (K8s) and use kops to launch and manage K8s clusters on AWS. The build-it K8s integration in Datadog could provide a fairly comprehensive monitoring of the K8s cluster.
Most of the micro-services are deployed as stateless instances (a Deployment in K8s’ concept) to be scaled and scheduled easier, with few services stateful (StatefulSet). All these services in production cluster are configured to be High Available (HA) with multiple replications behind Elastic Load Balancer (ELB) via Services in K8s.
For on-premise version, things become simpler and DockerCompose is good enough to bring up our stack anywhere.
Configuration Management
For service configuration files, we use HOCON (Human-Optimized Config Object Notation. Its support of inheritance benefits us a lot in managing multiple sets of service configurations for different clusters with minimum effort. In the K8s cluster, all the configuration files are managed via ConfigMap.
Packaging & Release
Packaging
When it comes to packaging, using Docker to containerize all the components is the industry best practice nowadays. We follow this trend. All the services and third-party components are managed by Docker images.
Our own service images and customized third-party component images are all hosted on Elastic Container Registry (ECR) on AWS and DockerHub. These images are built and pushed during Continuous Integration (CI), which is covered below.
Release
We follow the Semantic Versioning 2.0.0 rules to manage our release versions. All the release versions are created by Git tags. Specifically, 1.x.x -> 2.0.0 for a major release, 1.0.x -> 1.1.0 for a minor release, 1.0.0 -> 1.0.1 for a patch release. In additional to that we also do pre-release version by adding -rc.x suffix, e.g., 1.0.1-rc.1. and for each Git commit on master branch, we also cut a snapshot version, e.g. 1.0.1-SNAPSHOT.
In addition to our production K8s cluster, we have 2 K8s clusters (test and staging clusters) mostly for testing purpose before releasing to the public. The SNAPSHOT release will be automatically released to the test cluster, which is primarily used for our engineering team to early test their latest changes. And the pre-release version (1.0.1-rc.1) was pushed to the staging cluster particularly for our QA engineer for testing. Only when we are OK with the performance of the staging cluster, will we continue to cut the final version and push to the production environment.
The release automation is achieved by Continuous Integration (CI). We use [GitHub] (https://github.com) to host and manage our own source code and [CircleCI] (https://circleci.com) for CI. Whenever a new version tag has been pushed to GitHub, CircleCI will be notified to trigger a Workflow, in which docker images are built and pushed to docker registry, and then K8s rolling update process is triggered to upgrade the entire stack on the corresponding cluster.
Development Tools
We use Git for eng team collaboration as all the 21st century eng teams do. GitHub is the place for source code hosting, issue tracking, and code review. CircleCI is integrated with our GitHub repositories for source code build and test.
We follow the single repository convention, as we did at Google, to organize our Git repository by pull the source code of all component into one single Git repository. For some third-party open-source repositories, we use Git submodule to glue them with our main repository.
We choose Gradle as our main build system since day one for source code build, test, and dependency management. In fact, with a super rich set of plugins, Gradle helps us to do any kind of customized automation tasks, such as tag release, sync S3 buckets, build and push docker images, etc.
More
This post and the last one [Insight.io Tech Stack (2) - Serving and Analysis Pipeline] () covers aspects from the serving to the infrastructure of the entire backend stack. There is still one big piece of the stack missing, which is the applications and frontend architecture. Javascript ecosystem dominates this area, which is a completely different world with the backend stack. This is covered in [Insight.io Tech Stack (4) - All About Frontend] () all the way from the frontend architecture to logging and monitoring, from infrastructure to dev tools.